Making data accessible
By Kimberly Coutts and Lisa Trescott
April 11, 2019
A California college is using dashboards to give the campus community a look at data.
Many colleges have concerns about publishing the good, the bad, and the ugly data related to student success. MiraCosta College asked, “What would happen if virtually all data was accessible to the entire campus community?”
During MiraCosta College’s redesign of the student experience through the application of the Pathway’s model, the college engaged in a collaborative year of inquiry and recognized gaps in student success. These included equity gaps based on several demographic factors and helped to identify the need for a scaled first-year experience.
To address these gaps, the college spent more than a year developing comprehensive, user-friendly dashboards. These dashboards provide opportunities for all faculty and staff to interact with the information and have immediate access to data assessing interventions. The dashboards incorporate metrics from instruction and student services for a comprehensive view of the student experience. Interactive and open to the entire campus community, these dashboards enable individuals, departments and the entire college to gain a common understanding of how students are progressing along key milestone points toward their educational goal.
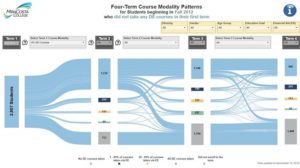
One dashboard, for example, follows students over four terms and explores the different patterns that emerge between on-ground and distance education enrollment. Examining students’ course-taking patterns helps the college predict how likely students are to enroll in future terms and the types of courses in which students will be most successful.

So far, the result of this accessibility has been overwhelmingly positive. For more details, contact MiraCosta College or attend the presentation “Airing Data Laundry: Student Success Data on Display College-Wide” at the 99th Annual AACC Convention.


